basic stock-style symbol
Start with the available GIS symbology and identify what is not working: silhouette, legibility, visual weight, or suitability for the map.
CASE STUDY 08 · CREATIVE TECHNOLOGY
SVG · Vector geometry · ArcGIS · Cartographic design
THE PROBLEM
GIS platforms provide extensive symbol libraries, but project-specific cartography often calls for something more precise. A symbol may need to resemble an established mapping convention, remain recognizable at multiple scales, match an existing visual language, or communicate something the default library simply cannot.
Rather than designing the map around that limitation, I build the missing piece.
An SVG is not simply a picture exported at a particular resolution. It is an XML-based description of vector geometry: paths, coordinates, fills, strokes, transformations, and other properties that tell a renderer how to construct the graphic.
That makes SVG especially useful for GIS. The same asset can remain crisp as it scales, stay lightweight, and be edited at the geometry or style level instead of repeatedly recreating a raster image.

<svg xmlns="http://www.w3.org/2000/svg" width="300" height="360" viewBox="0 0 300 360"> <path fill="#8E2748" fill-rule="evenodd" d="M139 12 C139 4 145 0 150 0 C155 0 161 4 161 12 L161 22 C193 27 217 48 224 80 ..." /></svg>viewBoxthe coordinate system
paththe vector geometry
dinstructions that construct the shape
fillthe symbol color
fill-rulehow overlapping path areas are filled
The code shown here drives the rendered symbol beside it. Project-specific production assets can be substituted with sanitized SVG markup where client context permits.
FROM REFERENCE → CODE → MAP
Start with the available GIS symbology and identify what is not working: silhouette, legibility, visual weight, or suitability for the map.
Reduce the reference to scalable geometry that remains legible at map scale.
<path fill="#8E2748"
 fill-rule="evenodd"
 d="M139 12 C139 4…" />
Control the asset through XML-based SVG structure rather than fixed pixels.
Test size, contrast, anchoring, labels, and surrounding map context.
FROM REFERENCE TO REUSABLE GIS ASSET
Identify the essential geometry, proportions, line weight, orientation, and characteristics that make the symbol recognizable.
Remove unnecessary detail while preserving visual identity. GIS symbols often need to remain legible far smaller than the source artwork.
Construct the symbol from scalable paths and shapes rather than fixed-resolution imagery.
Test dimensions, viewBox behavior, fill and stroke properties, transparency, anchoring, rotation, and scaling inside the mapping environment.
A symbol that works alone may fail over imagery, parcels, utilities, labels, or other features. Iteration happens on the map—not just in the SVG editor.
ONE TECHNIQUE · VERY DIFFERENT APPLICATIONS
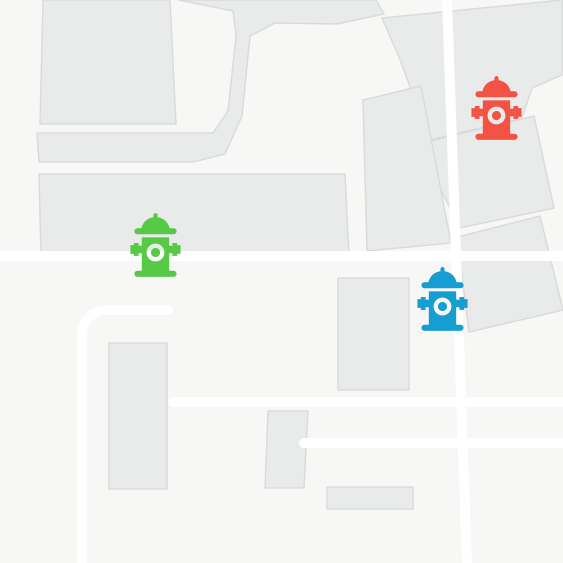
A municipal utility dataset called for a more distinctive hydrant symbol than the stock options provided. The challenge was recognizability at small map scales without excessive detail.
Build a reusable vector asset tailored to the feature being represented.

Here the goal is different: not inventing a new visual language, but translating an established cartographic convention into an interactive GIS environment while preserving clarity.
Make the digital map feel consistent with information users already recognize.
THE REAL ADVANTAGE
It isn’t that SVGs
look nicer.
It’s control.
When the map needs a symbol that does not exist, I do not have to design around that limitation. I can build the symbol the map needs.
TOOLS + TECHNIQUES
WHAT THIS DEMONSTRATES
Creating project-specific resources rather than relying exclusively on software defaults.
Understanding how geometry, scale, contrast, hierarchy, and labeling interact in an operational map.
Designing an asset outside the GIS and adapting it to the constraints of the environment where it will actually be used.
Treating software limitations as design constraints rather than the end of the solution.
THE LARGER LESSON
Sometimes the clearest solution is to build the missing piece.